I'm going to try and share some of the techniques and methods I use as a consultant. Using Tableau & Alteryx daily means that I've found I take small techniques, tips & tricks for granted. Hopefully this will be useful for you all.
One of the things I love about Tableau is that I never stop learning new things. Recently, I was supporting my colleague Luke Stoughton teach Tableau to a group of university students - and I learned something about filters I'd never used or heard about.
When on a dashboard, there are a few methods to add interactivity - you are able to show different filters from your respective views/sheets, and apply them across multiple worksheets. Alternatively, and perhaps more obviously, you are able to use dashboard actions.
Reminder!
There are 3 kinds of dashboard action; Highlight, Filter and URL. These can be set to be triggered when the end user hovers, selects or 'clicks the menu' of the respective dashboard element. This can then be set across source sheets (ie. The sheet which you click) and target sheets (ie. The sheets which will filter upon these actions). A step further is to select the fields (dimension or measure) to filter.
So what did I not know?
When you create a filter a action, there is an arrow to right - which I've never paid much attention to. When you click this arrow, you are presented with a number of fields.
So let's take this really simple dashboard - Superstore Sales, a map and a bar.
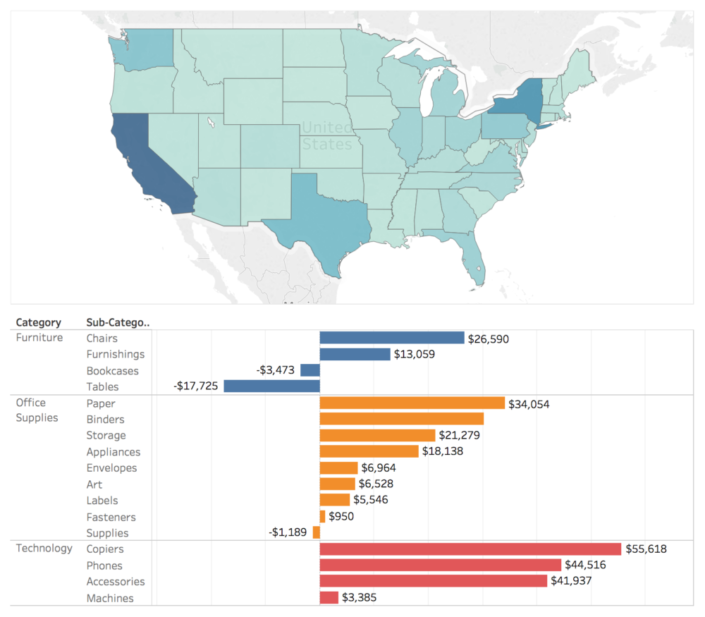
There are two ways of creating actions - on a dashboard using the little funnel icon (only for filter though, with no customisation) or using the menu bar - Dashboard > Actions..
This then pops up a window, and if we select Filter, for example, this window pops up.
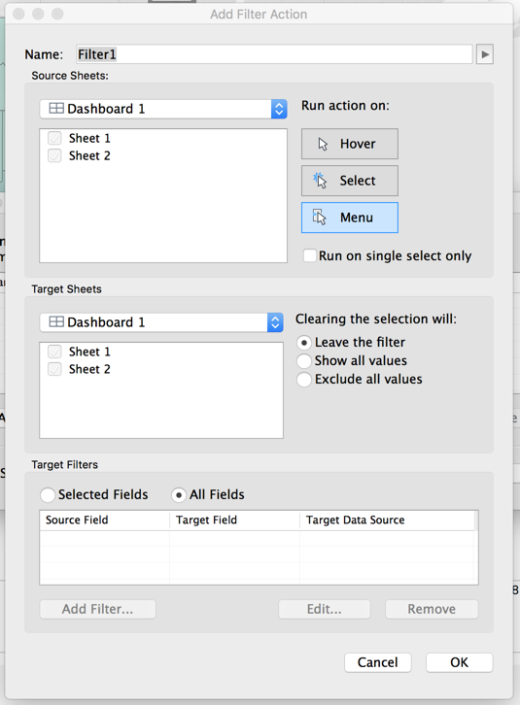
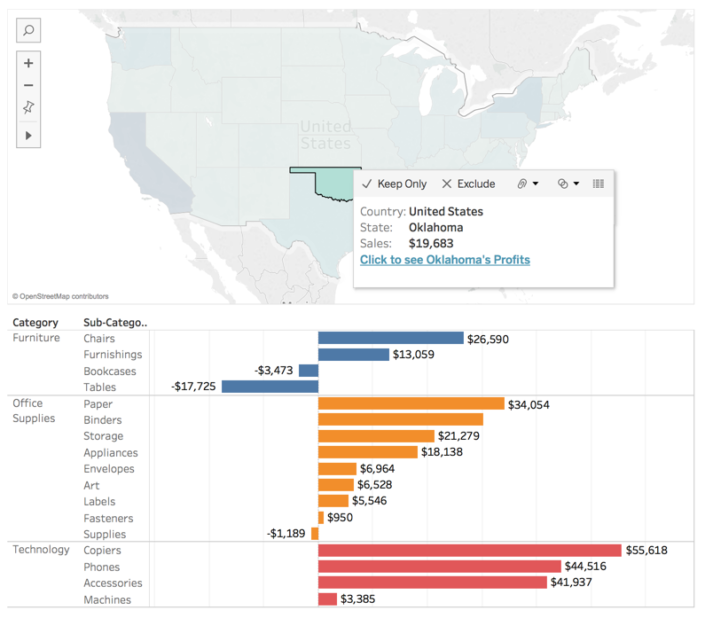
The arrow alongside the 'Name' field is similar to adding a <Parameter> field to your titles - it dynamically updates depending on the field. I'd never heard of this or even thought to use it before. In terms of user interface, what it can do - for example if you select your Filter action to be run on a "Menu" selection - it will update depending on the field you've selected. Here's an example:
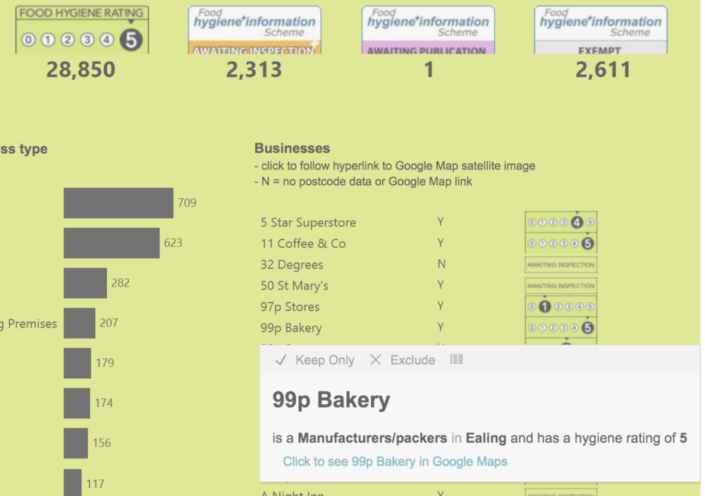
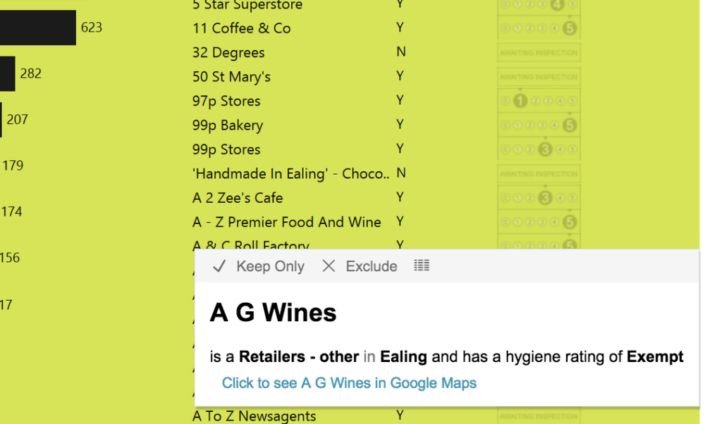
This level of customisation can really help your visualisation be more user friendly and dynamic. A great example of this in the wild is Luke's Hygiene Rating visualisation (here: https://public.tableau.com/profile/luke.stoughton8750#!/vizhome/FoodHygieneRatings_0/FoodStandards). In this, Luke allows the user to click a URL action which changes depending on the establishment you select:
