This blog was originally posted on The Information Lab: https://www.theinformationlab.co.uk/2015/11/04/fixed-level-detail-intricacies-case-study/
Preamble
Level of detail calculations are super duper tricky - Having used Tableau for the last four months at an intensive pace and level, I find myself steering away from level of detail where I can. So when an instance occurs when I need to use it, I either find myself thinking it through with minute detail, or referring back to a session with had the Queen of LOD’s, Bethany Lyons - My notes actually come in handy in this instance!
As some of you may be aware, the Data School have already recruited for the next cohort of Data Padawans that The Information Lab are looking to mould into awesome Data Consultants. This intensive process included (as you can read here) a simple Tableau creation process, and followed by each interviewee getting given a similar data set. The beauty of this? Not only is it a chance to experience the world of Tableau and really get to grips with how it works, but it is also an opportunity to ask questions, learn and develop your skills as Andy and the rest of the team are always happy to answer questions, critique and help the interviewees during the process. This is an amazing opportunity for feedback, especially (in my experience anyway), a large amount of applications and notes made during the process disappear into the netherworld, never to be seen or heard from again. The transparency is amazing.
The Exercise
Back to the purpose of this post - As a warm-up a few weeks ago as the Data School training was winding down, Andy Kriebel set us a challenge to answer a question one of the candidates had asked; how to work out the minimum and maximum life expectancy for;
<ul><li>Each Local Authority</li><li>Each Gender</li><li>For every date range</li><li>Where there are no nulls, the metric used is average, and the age category is ‘at birth’</li></ul>The reason for doing analysis like this could be to see whether or not there is a change in the movement of the distance between the highest and lowest ‘years left to live’ value. Which is actually a good idea, as if this gap widens in some areas in the same year as it gets smaller in others, then perhaps one ward is more successful than others and their practices should be implemented.
So creating something like this (here we have the basic calculations of MIN and MAX in the viz) should work right?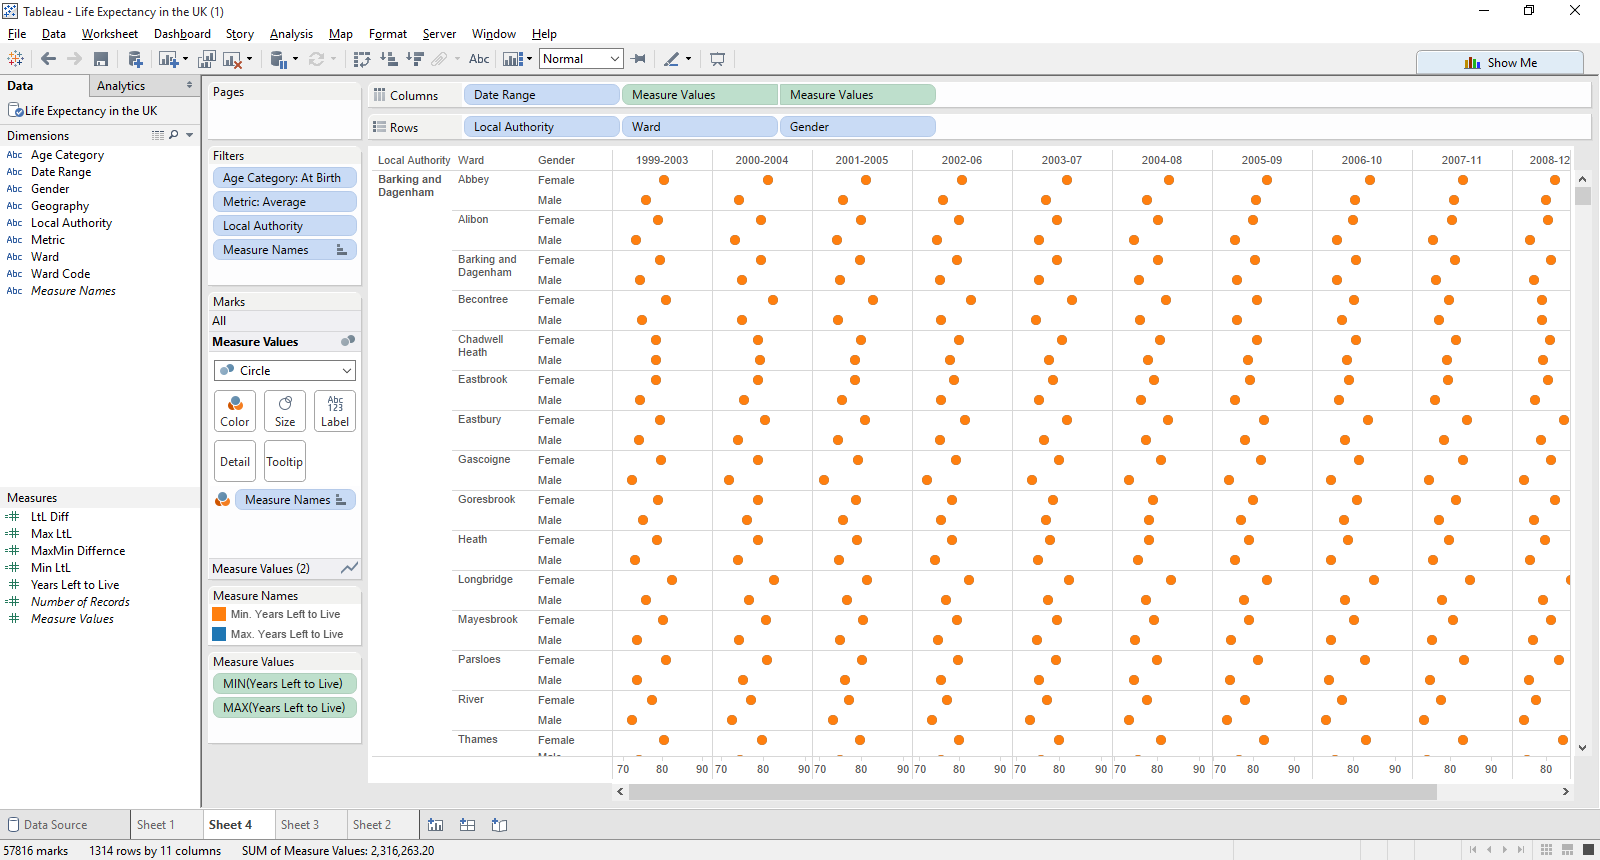
No - This doesn’t seem to work as the visualisation is returning the same value for minimum and maximum for each one of these marks, as it’s the lowest level of granularity. The difference is obvious when you take things at the local authority level. But the question, if you remember is this; if you rank the ward by any measure then you can’t compare the difference in gender, for instance or see the minimum or maximum for the life expectancy (years left to live) measure.
The Action
What we want for this one is to not allow Tableau to aggregate at the default level, but instead to determine at which level of detail Tableau should be running it’s calculations.
So the ‘level of detail’ that needs to be aggregated up & fixed to is at the Local Authority and Gender level. So my first attempt used a Fixed level of detail.
Fixed aggregates at the specific level of detail of the expression, regardless of what is present in the view. With this in mind, my first attempt was this.![]()
Max LtL as { FIXED [Local Authority], [Gender] : MAX([Years Left to Live]) } for the maximum value![]()
Min LtL as { FIXED [Local Authority], [Gender] : MIN([Years Left to Live]) } for the minimum value![]()
LtL Diff as [Max Ltl] - [Min Ltl]
And the is what the result I was given was.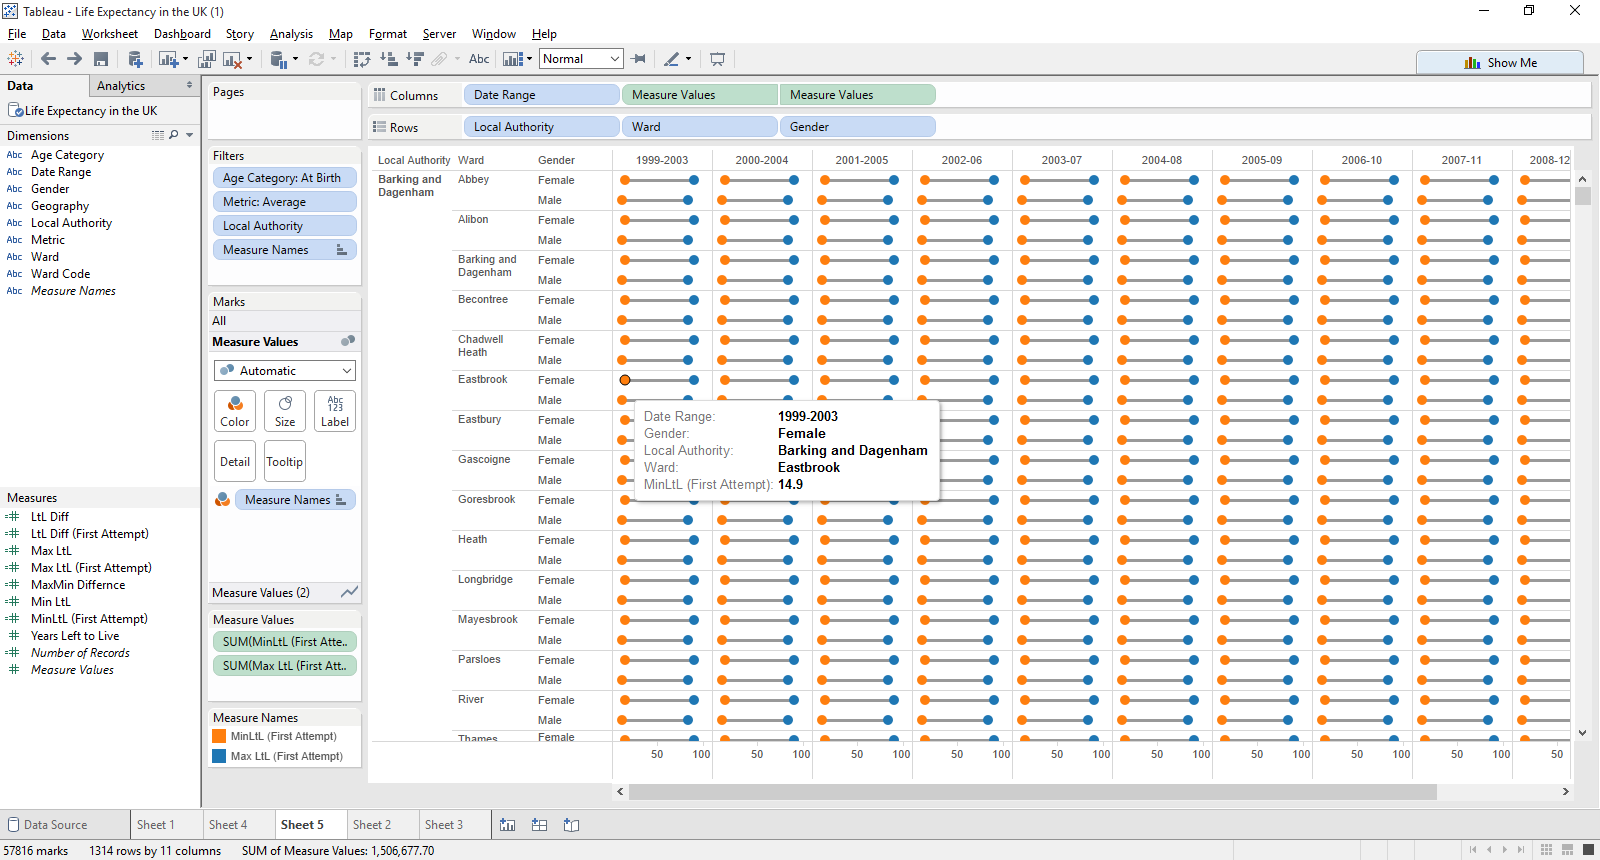
This seems a remarkable high range, even at birth - It doesn’t make sense for the minimum life expectancy for a male or female to be 70 years apart from the maximum level of detail given. For instance in the example above, we can see that for the years 1999-2003, a female in the Eastbrook ward of Barking & Dagenham, the minimum years left to live is 14.9 years; a difference of almost 70 years.
All the values for the Local Authority are now at the same level of detail, but the result definitely can’t be right! (I hope!)
However, this doesn’t give the correct answer because in order for the fixed level of detail to work, all dimensions which are being addressed need to be in play within the calculation - so instead, our LOD calculation would be;![]()
Max LtL as { FIXED [Local Authority], [Gender], [Metric],[Age Category],[Date Range] : MAX([Years Left to Live]) } for the maximum value![]()
Min LtL as { FIXED [Local Authority], [Gender], [Metric],[Age Category],[Date Range] : MIN([Years Left to Live]) } for the minimum value![]()
LtL Diff stays as [Max Ltl] - [Min Ltl]
Giving us this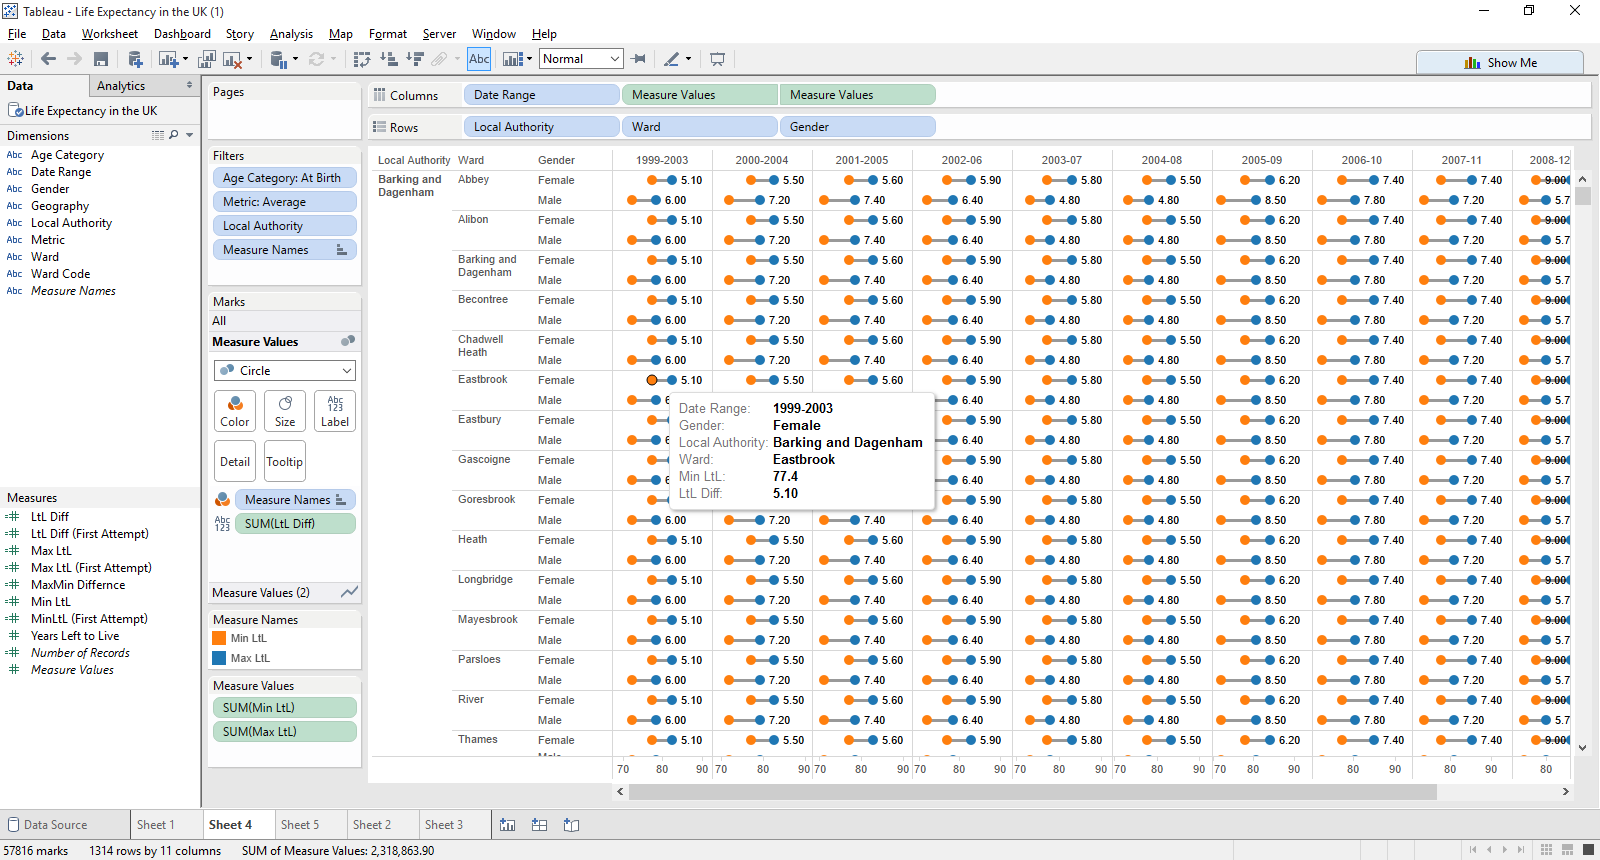
Much better. Now in the years 1999-2003, a female in the Eastbrook ward of Barking & Dagenham has a minimum life expectancy of 77.4 years, with a small difference of 5.1 years. This seems to be correct.
The Lesson
So, the question was how to work out the minimum and maximum life expectancy for;
<ul><li>Each Local Authority</li><li>Each Gender</li><li>For every date range</li><li>Where there are no nulls, the metric used is average, and the age category is ‘at birth’</li></ul>And in order to do this, all the dimensions (blue pills) in the view must be included in the Level of Detail calculation. As you can see, before the colon you have every pill which is in the view. In order for the calculation to work, every dimension which is in the view must be taken in the calculation. This makes sure that all of these are held as fixed, meaning that the calculation is left at this high level of detail.
After conversing with Chris Love about this post, he mentioned that the first attempt can also be remedied using context filters. This is because the FIXED level of detail calculation doesn’t take filters into account unless they are in context. So adding Metric and Age Category to context also works in this instance.
The reason for sharing this was to show an example where understanding how the “ { FIXED “ function can be used, but also to highlight once more that within Tableau, there is more than one way to reach a solution.
Have a look at the workbook I’ve uploaded Tableau Public; click on the image below to have it pop up.
It’s got the two sheets - My first attempt, and second, with the data attached for you to explore further and understand the exercise.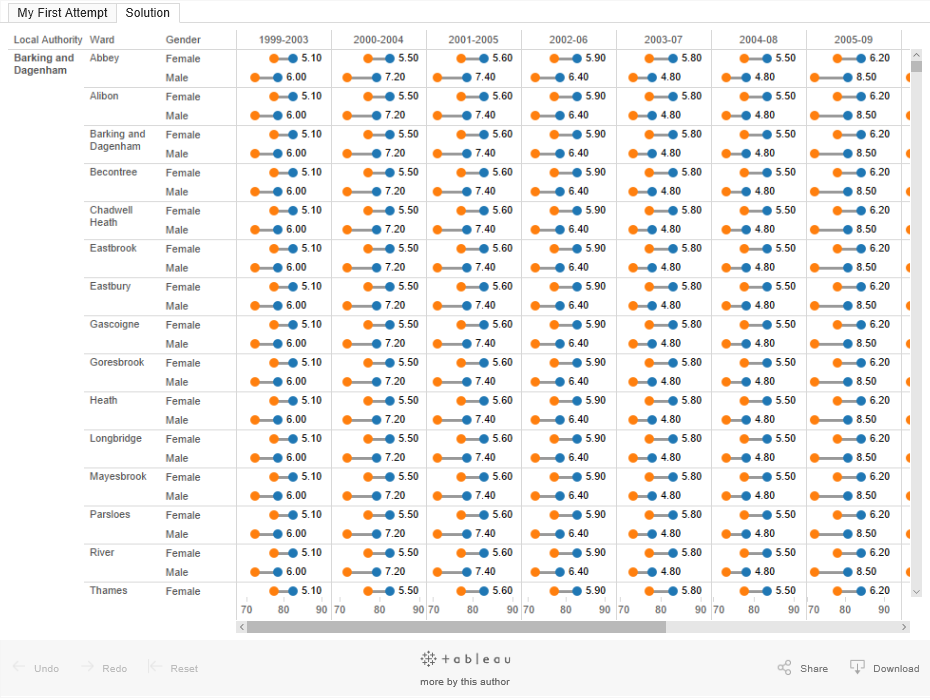
If I’ve made any errors in how I’ve communicated or explained this, please let me know so I can edit the post accordingly, and more importantly, carry on learning.