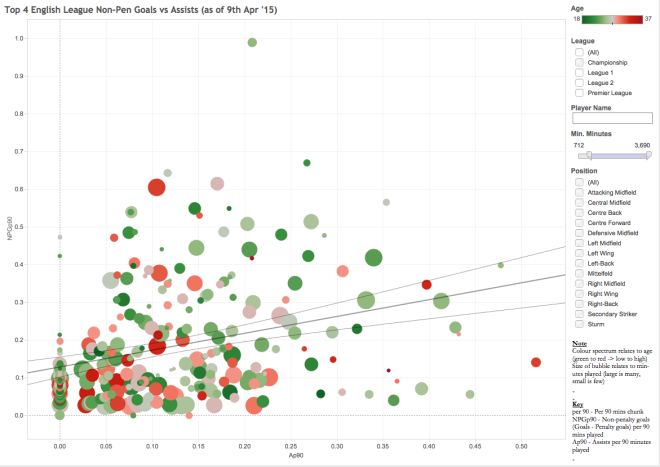
So, yesterday I messed around on Tableau with data from last season’s League 1 players; And today, I used transfermarkt as a resource to get plain and simple goals, penalty goals and assist data for the four leagues in English football - I think this is a good way to show the benefits of data visualisation, and particularly in terms of player assessment.
The output of offensive players is much easier to see than defensive - They’re assessed on their goals, their goal ratio, their impact on goals for the team etc etc. And I think this dashboard helps give some sort of insight.
I’m not sure how useful the trend-line is, and whether it is worthwhile leaving it in there for the future - But for this one I have made it a bit more interactive - Find the player you like, split by position (as defined by TransferMarkt) and use the sliders to change the minutes.
Any feedback/comments more than welcome, feel free to also tweet and follow! @Scribblr_42