https://public.tableau.com/profile/scribblr.42#!/vizhome/Messingaround/Dashboard1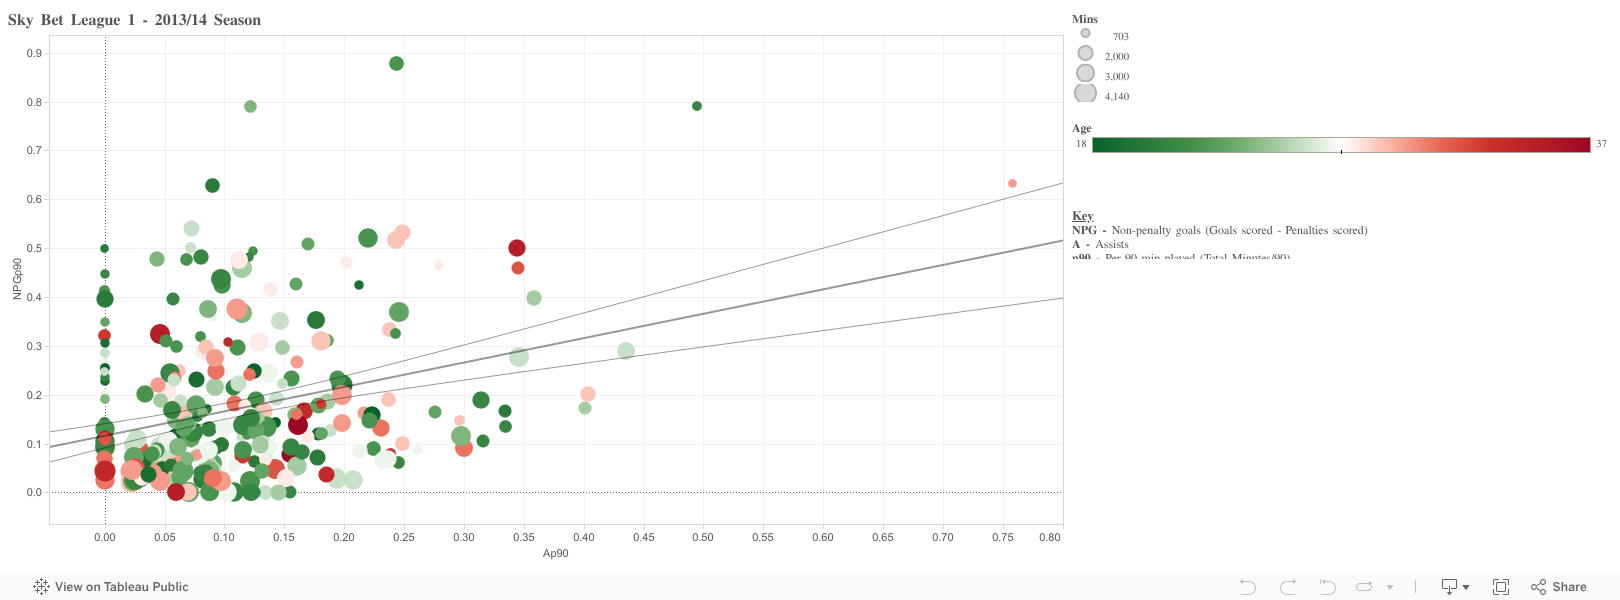
So I had a mess around with Tableau, both yesterday and today - My first go was after Neil Charles put up his excellent “How to..” guide a month or so ago, but I didn’t have any real data.
And then it struck me, that I had a horde of Sky Bet League 1 and (more extensive, however sketchy) Championship data to mess around with. So I did - And I’ve ended up with the above very simple dashboard. (Let me know if it works..!)
So what I’ve got is non-penalty goals per 90 on the y-axis and assists per 90 on the x-axis. The size of the bubble indicates the amount of minutes played (Started at a minimum of 700, as to not get any wildcard players with stupid number involved) and the green-white-red gradient indicates age - Which I thought would be quite interesting - Note Lisbie and Akinfenwa.
I’ve also added in a trend-line, with the statistical description from Tableau included as an image on the right, as well as a key. I think there’s actually quite a lot you can do with this, so it’ll be cool to do a full season breakdown analysis once may comes around - Hopefully with data for each Championship team. But yes, this is a first play around and any feedback, pointers etc. are more than welcome!